
How to Create a PowerPoint Map with County Lines
You need a map of your state in PowerPoint, with the county lines showing, so you can color the counties you care about — your service area, your sales territory, your coverage zone. This guide walks you through it, step by step. No design skills needed, and the whole thing takes about ten minutes.
By the end you will have a clean, labeled county map sitting on your own slide, in your own colors, ready for a sales presentation, a proposal, or your website.
Why a normal map picture does not work
Most map images you find online are flat pictures. You can paste one into PowerPoint, but you cannot color a single county — the whole picture is one piece. What you need instead is a map where every county is its own separate shape. Then each county can be clicked, colored, and labeled on its own. That is the only trick to this whole guide: start with the right kind of map.
Step 1 — Start with a county map made of separate shapes
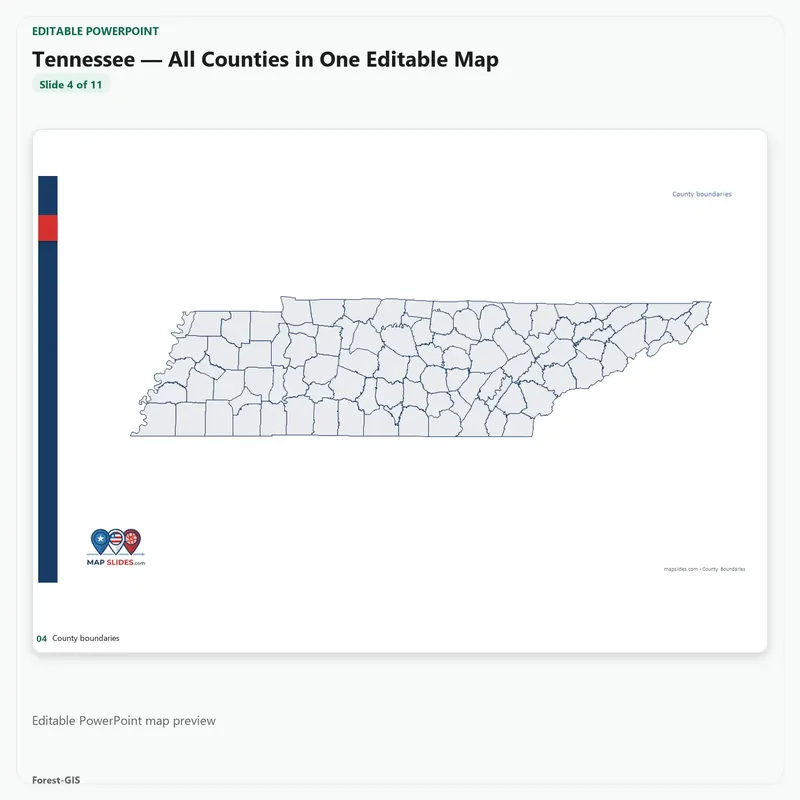
Open a county map slide where each county is an individual PowerPoint shape. Every MapSlides state pack is built exactly this way — one slide per state, every county a separate shape, with a labeled and an unlabeled version. Pick your state and open the slide.
Work in just one county? Start with a county detail pack instead — one county in depth, with seven views of it (more on those below). Either way, every shape is separate and editable.
Step 2 — Pick the counties you want
Click any county to select it. Hold the Shift key and click more counties to select several at once — for example, every county your team covers. Selected counties show a dotted outline so you can see exactly what you have picked.
Step 3 — Color them with Shape Fill
With your counties selected, go to Shape Format → Shape Fill and pick a color. Your counties fill in instantly. Use your company color for your main area, a second color for a second branch or zone, and leave the rest light gray. This is the step that turns a plain state map into your map.
Step 4 — Add labels and a title
Switch to the labeled version of the slide (or turn the county names on) so every county shows its name. Add a title at the top — “Our Service Area,” “2027 Sales Territories,” whatever the map is for. You now have a finished slide you can drop into any presentation.
For HVAC, roofing and home-service companies: the service-area map
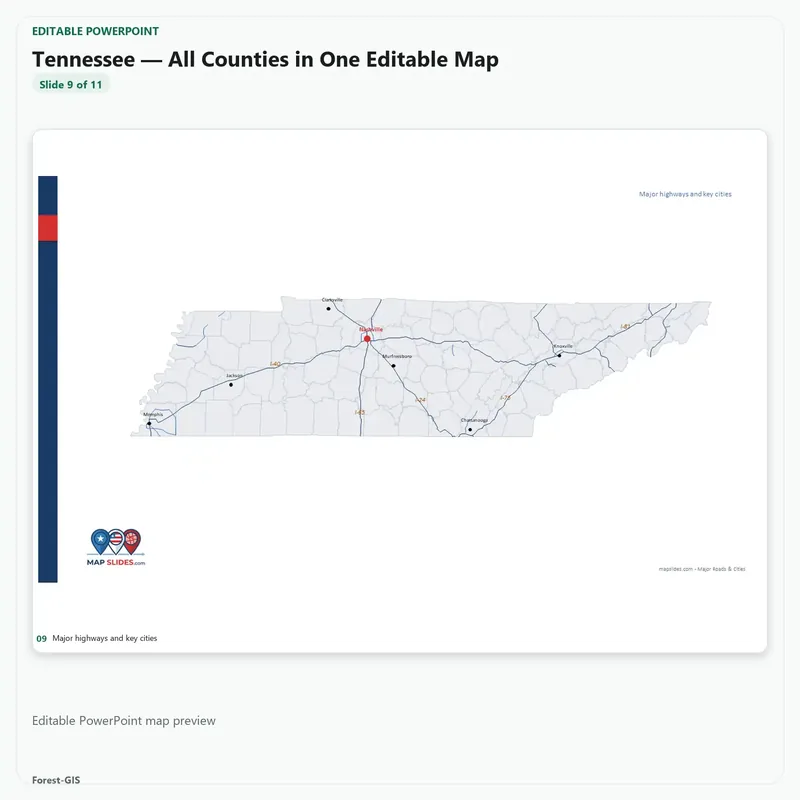
This is the map service companies ask us for most. Color the counties your crews actually cover, one color per branch if you have several, and you have a service-area map you can reuse everywhere:
- Proposals and quotes — show the customer exactly where you work, in your brand colors.
- Your “areas we serve” page — one clear map beats a long list of town names.
- Branch and technician planning — split counties between branches or crews and spot the gaps nobody covers.
- Storm and seasonal planning — highlight the counties you push after a hail storm, a freeze, or a heat wave.
- Hiring — show new technicians the exact territory they will run.
A heating and air company around Charlotte, for example, colors its six home counties red, its expansion counties blue, and has a coverage map it uses in every sales deck. A roofing company in Dallas does the same with its six DFW counties after storm season. If your business runs on counties, this is your map.
Start with your state: every state pack has all of its counties as separate editable shapes on one slide — Texas (254 counties), North Carolina (100 counties), Florida (67 counties), California (58 counties) — $14.95 per state.
Working in just one county? Get that county in detail
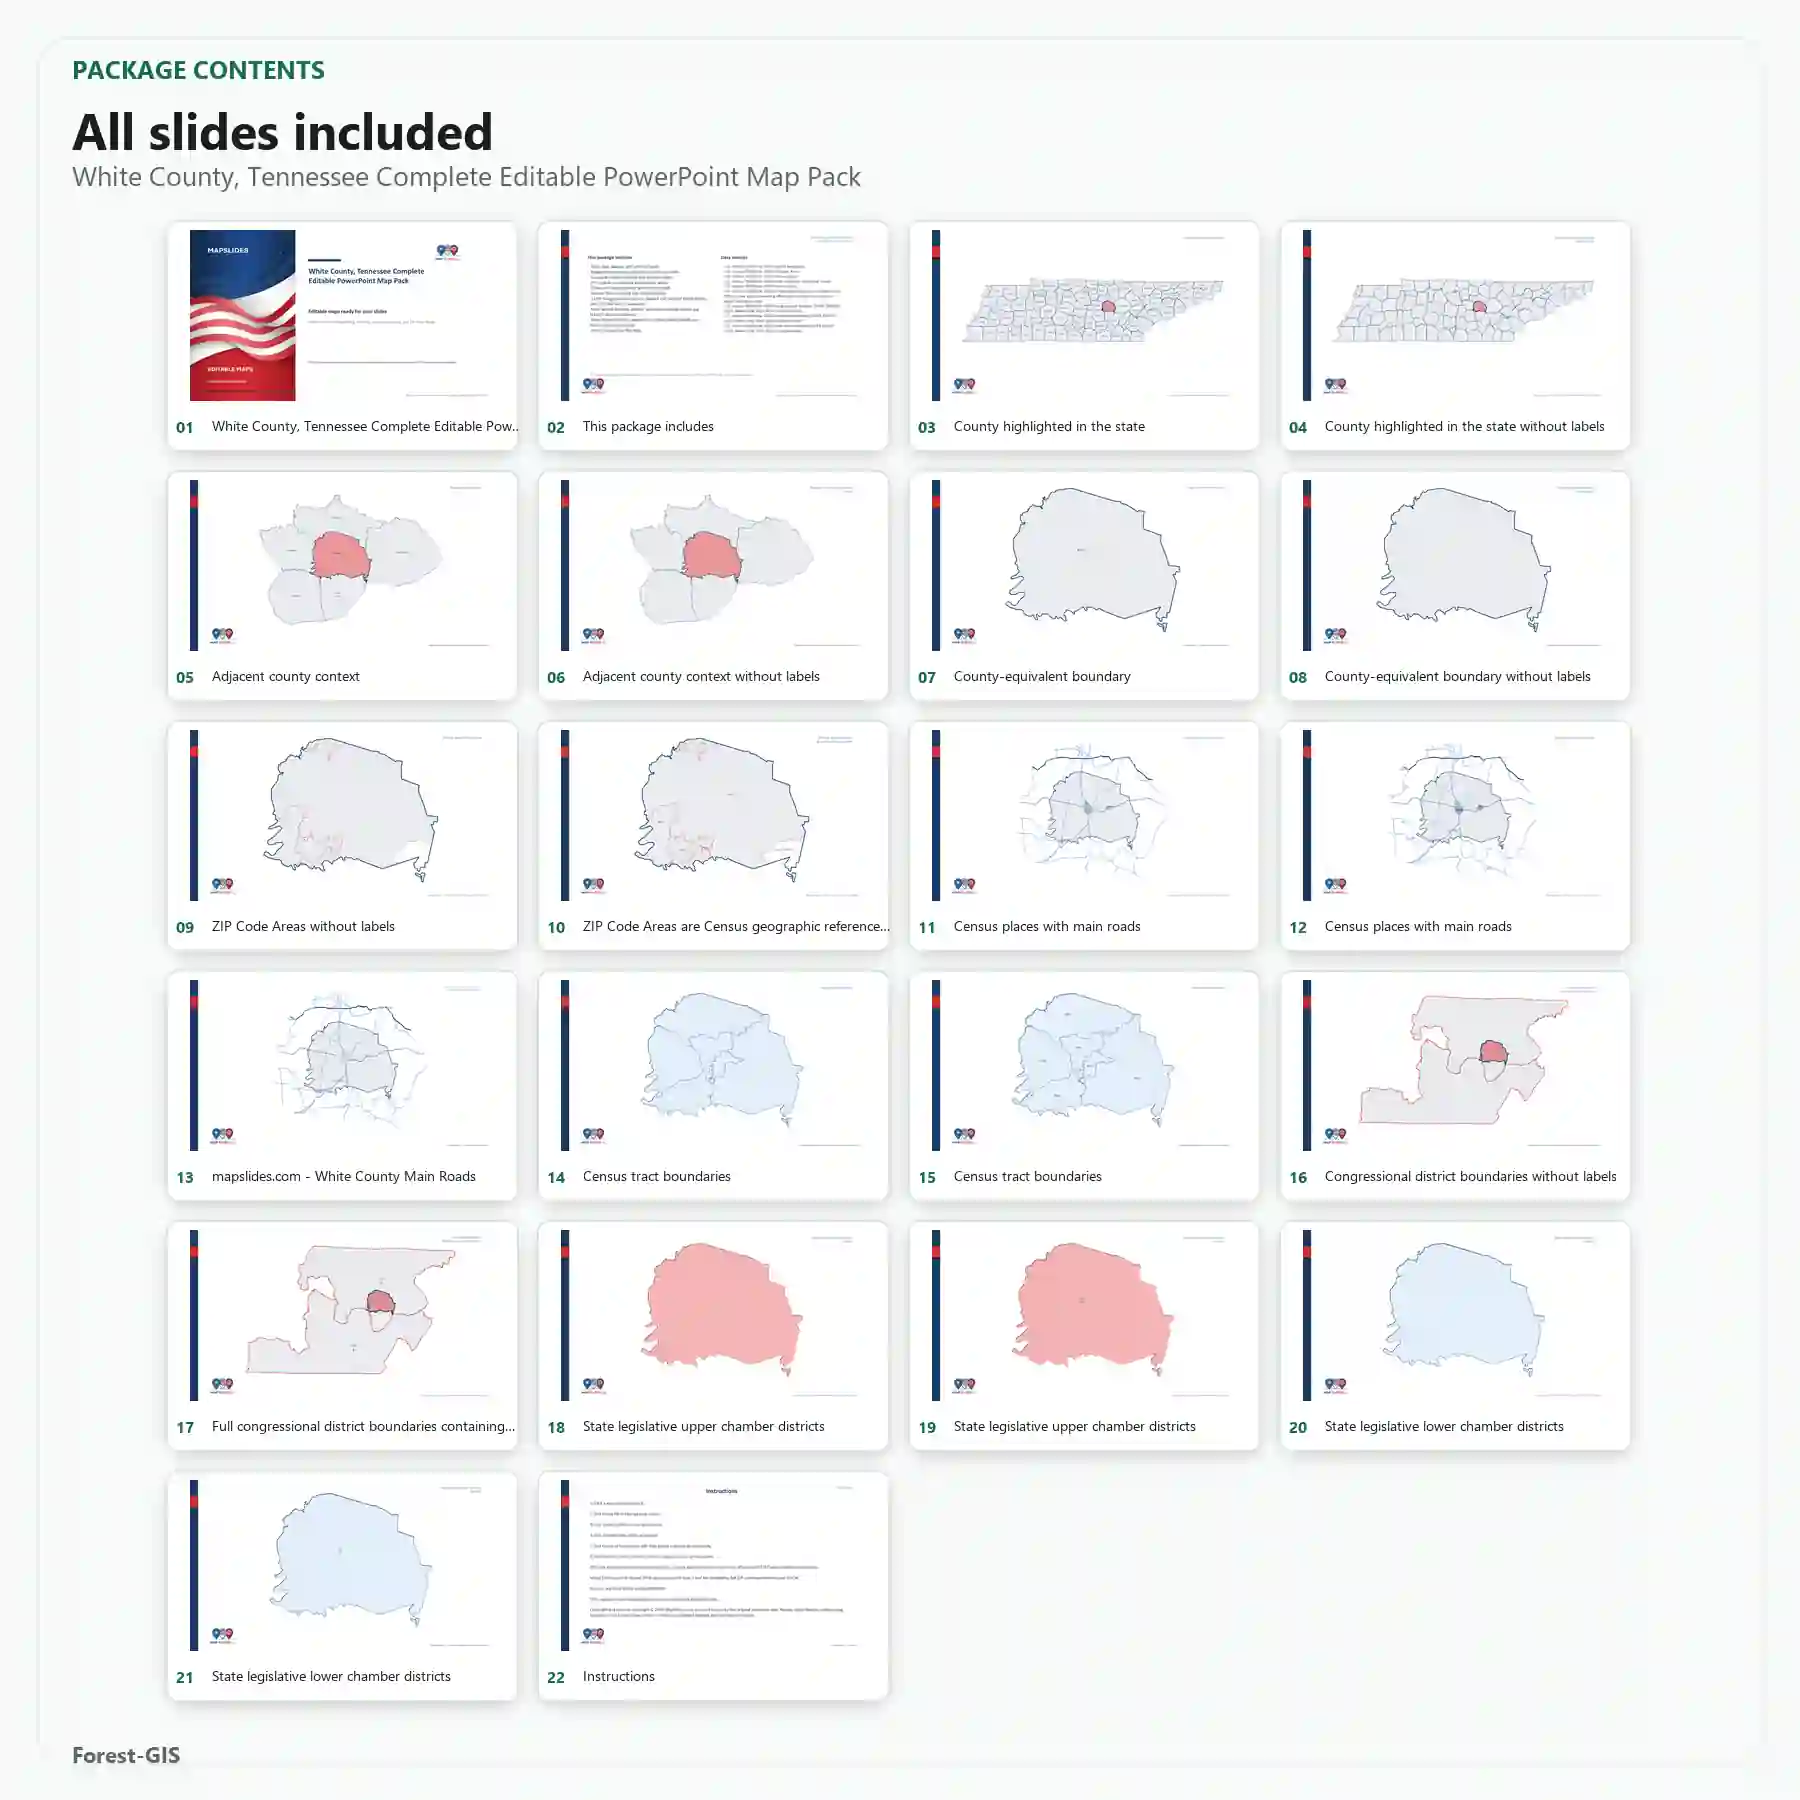
Plenty of service companies live inside a single county — one county, a handful of towns, a set of ZIP codes. For that, a state slide is too wide. The county detail packs zoom in: one county, seven views — the county outline plus census tracts, ZIP code areas, school districts, legislative boundaries and more, every layer a separate editable shape in PowerPoint and SVG. Color the ZIP areas you cover, mark the neighborhoods you target, and show exactly where in the county you work. County detail packs are $24.95 — pick your county from the shop, all 3,000+ U.S. counties are there.
Also used for: sales territories, real estate, teaching
Sales managers color one color per rep and rebalance territories in minutes. Realtors show listing coverage by county. Teachers build fillable state map quizzes — students color and label counties themselves. If you need the whole country, the all U.S. counties slide puts every county in America on one slide, and the custom sales territory map is built for multi-state territory planning.
Common questions
Can I color just one county? Yes. Click it, Shape Fill, done. Every county is independent.
Can I change the colors later? Any time. The map stays fully editable — colors, labels, and titles are all normal PowerPoint shapes and text.
Does it work in Google Slides or Keynote? The packs also include SVG files, which work in Google Slides, Keynote, and design tools.
What if my area covers two states? Use one slide per state, or the regional and full-U.S. slides — counties keep the same style across every pack.
Your turn
Pick your state, click your counties, fill them with your color. Ten minutes from now you have a service-area or territory map that looks like a designer made it. Browse the state packs and start with the state you work in.